Why Do Oracle DB File Sequential Reads Show Up in a Full Table Scan?
f you trace or monitor a full table scan operation closely, you may find db file sequential read eventssandwiched between db file scattered read events. This may or may not be a problem depending on the circumstance of the single-block read. Following are the four primary reasons why you see db file sequential read events in a full scan operation.
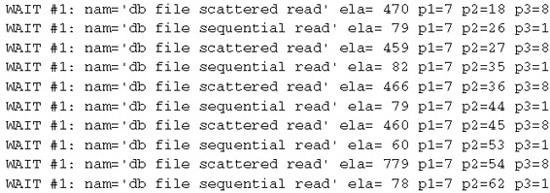
- Extent boundary When the last set of blocks in an extent is only 1 block, Oracle fetches that block with a single-block read call. This is normally not a problem unless your extent size is too small. Following is an event 10046 trace file that shows db file sequential read events embedded in a full table scan operation. The table block size is 8K, the MBRC is 8 blocks, and the extent size is 72K (9 blocks). A full table scan against the table will result in many db file sequential read events if the table is large. If this is the case, the full table scan operation will complete faster if the table is rebuilt with a larger extent size.
- Cached blocks See explanation in the “Why Does a Full Scan Operation Request Fewer Blocks than the MBRC” section. This is not a problem.
- Chained or migrated rows It is a problem if you see many db file sequential read waits against a table when the execution plan of the SQL statement calls for a full table scan. This indicates the table has many chained or migrated rows. Oracle goes after each chained or migrated row with the single-block I/O call. Check the table’s CHAIN_CNT in the DBA_TABLES view. Of course, the CHAIN_CNT is as of the LAST_ANALYZED date. Migrated rows can be corrected by reorganizing the table (export and import, or ALTER TABLE MOVE).
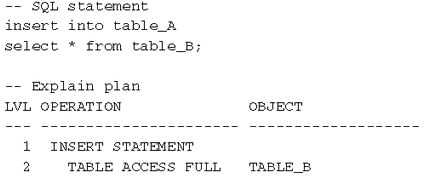
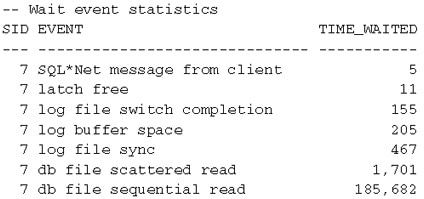
- Index entry creation It is not a problem if you see many db file sequential read waits against an index when the execution plan of the SQL statement calls for a full table scan. In the following example, TABLE_A has an index and the db file sequential read waits were the result of reading index blocks into the SGA to be filled with data from TABLE_B. Notice the magnitude of the db file sequential read waits versus the db file scattered read in the statistics. This means you cannot always assume which bottlenecks you will see from looking at an execution plan. Most DBAs would expect to see a lot of db file scattered read events. Another point worth noting is that the db file sequential read wait event does apply to insert statements. The common misconception is that it only applies to update and delete statements.
==============================================================
Minimizing Oracle db file sequential Read Wait Events?
There are two things you can do to minimize the db file sequential read waits:
- Optimize the SQL statement that initiated most of the waits by reducing the number of physical and logical reads.
- Reduce the average wait time.
Unless you trace a session with the event 10046 or have a continuously running wait event data collector, it is difficult to determine the SQL statement that is responsible for the cumulated wait time. Take the preceding SID #192 again, for example. The 243113 centiseconds wait time may be caused by one long-running or many fast SQL statements. The latter case may not be an issue. Furthermore, the SQL statement that is currently running may or may not be the one that is responsible for the waits. This is why interactive diagnosis without historical data is often unproductive. You can query the V$SQL view for statements with high average DISK_READS, but then how can you tell they belong to the session? Due to these limitations, you may have to identify and trace the session the next time around to nail down the offending SQL statement. Once you have found it, the optimization goal is to reduce the amount of physical and logical reads.
NOTE
In addition to the DISK_READS column, the V$SQL and V$SQLAREA views in Oracle Database 10g have exciting new columns: USER_IO_WAIT_TIME, DIRECT_WRITES, APPLICATION_WAIT_TIME, CONCURRENCY_WAIT_TIME, CL USTER_WAIT_TIME, PLSQL_EXEC_TIME, andJAVA_EXEC_TIME. You can discover the SQL statement with the highest cumulative or average USER_IO_WAIT_TIME.
Another thing you can do to minimize the impact of the db file sequential read event is reduce the AVERAGE_WAIT time. This is the average time a session has to wait for a single block fetch from disk; the information is available in the V$SESSION_ EVENT view. In newer storage subsystems, an average single-block read shouldn’t take more than 10ms (milliseconds) or 1 cs (centisecond). You should expect an average wait time of 4 to 8ms (0.4 to 0.8cs) with SAN (storage area network) due to large caches. The higher the average wait time, the costlier it is to perform a single-block read, and the overall process response time will suffer. On the other hand, a lower average wait time is more forgiving and has a lesser impact on the response times of processes that perform a lot of single-block reads. (We are not encouraging you to improve the average wait time to avoid SQL optimization. If the application has SQL statements that perform excessive amounts of single-block reads, they must first be inspected and optimized.) The db file sequential read “System-Level Diagnosis” section has some ideas on how to improve the AVERAGE_WAIT time.
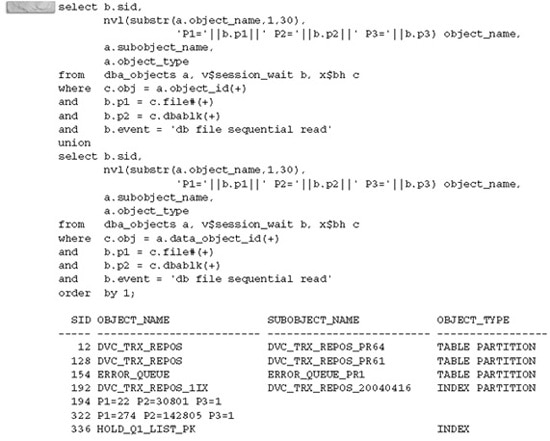
As you monitor a session and come across the db file sequential read event, you should translate its P1 and P2 parameters into the object that they represent. You will find that the object is normally an index or a table. The DBA_EXTENTS view is commonly used for object name resolution. However, the DBA_EXTENTS is a complex view and is not query-friendly in regards to performance. Object name resolution is much faster using the X$BH and DBA_ OBJECTS views. The caveat is that you must wait for the block to be read into the buffer cache; otherwise the X$BH view has no information on the buffer that is referenced by the P1 and P2 parameters. Also, the DBA_OBJECTS view does not contain rollback or undo segment objects that the P1 and P2 parameters may be referencing.
=====================================================================
Understanding the Oracle db file sequential read Wait Event ?
The db file sequential read wait event has three parameters: file#, first block#, and block count. In Oracle Database 10g, this wait event falls under the User I/O wait class. Keep the following key thoughts in mind when dealing with the db file sequential read wait event.
- The Oracle process wants a block that is currently not in the SGA, and it is waiting for the database block to be read into the SGA from disk.
- The two important numbers to look for are the TIME_WAITED and AVERAGE_WAIT by individual sessions.
- Significant db file sequential read wait time is most likely an application issue.
Common Causes, Diagnosis, and Actions
The db file sequential read wait event is initiated by SQL statements (both user and recursive) that perform single-block read operations against indexes, rollback (or undo) segments, and tables (when accessed via rowid), control files and data file headers. This wait event normally appears as one of the top five wait events, according to systemwide waits.
Physical I/O requests for these objects are perfectly normal, so the presence of the db file sequential read waits in the database does not necessarily mean that there is something wrong with the database or the application. It may not even be a bad thing if a session spends a lot of time on this event. In contrast, it is definitely bad if a session spends a lot of time on events like enqueue or latch free. This is where this single-block read subject becomes complicated. At what point does the db file sequential read event become an issue? How do you define excessive? Where do you draw the line? These are tough questions, and there is no industry standard guideline. You should establish a guideline for your environment. For example, you may consider it excessive when the db file sequential read wait represents a large portion of a process response time. Another way is to simply adopt the nonscientific hillbilly approach—that is, wait till the users start screaming.
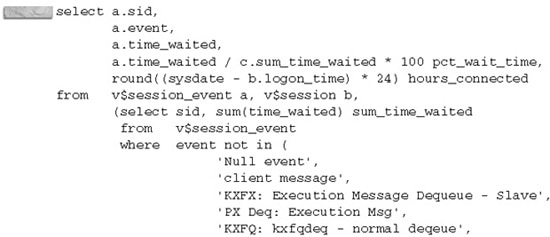
You can easily discover which session has high TIME_WAITED on the db file sequential read wait event from the V$SESSION_EVENT view. The TIME_WAITED must be evaluated with the LOGON_TIME and compared with other nonidle events that belong to the session for a more accurate analysis. Sessions that have logged on for some time (days or weeks) may accumulate a good amount of time on the db file sequential read event. In this case, a high TIME_WAITED may not be an issue. Also, when the TIME_WAITED is put in perspective with other nonidle events, it prevents you from being blindsided. You may find another wait event which is of a greater significance. Based on the following example, SID# 192 deserves your attention and should be investigated:
=================================================================
Understanding Oracle Write Complete Waits?
he write complete waits event has two parameters: file# and block#. In Oracle Database 10g, this wait event falls under the Configuration wait class. Keep the following key thought in mind when dealing with the write complete waits event.
- The Oracle session is prevented from modifying a block that is being written by the DBWR process.
Common Causes, Diagnosis, and Actions
The write complete waits latency is symptomatic of foreground processes needing to modify blocks that are marked by the DBWR process as “being written.” Blocks that are marked “being written” cannot be modified until they are written to disk and the flags are cleared. If a session spends a lot of time waiting on the write complete waits event, it is usually due to one or a combination of the following reasons:
- Slow I/O subsystem causing high DBWR write time
- MTTR is too short
- DBWR write batch size is too large
When the effectiveness of the DBWR process is impacted by the I/O subsystem, it can have a domino effect on foreground processes in terms of write complete waits and free buffer waits latencies. The write complete waits latency is usually a secondary problem. You should focus on the average wait time of the db file parallel write event. Any improvement to the DBWR average write time should also minimize the write complete waits latency.
A short MTTR can produce a hyperactive DBWR process. While an active DBWR process is beneficial for supplying clean buffers, it tends to write hot buffers out repeatedly. Sessions that actively perform DML operations can find themselves waiting on the write complete waits event. Therefore, make sure the FAST_START_ MTTR_TARGET parameter is not set too low. One way to find out is to trace the DBWR process with the event 10046 at level 8 and observe the write calls (db file parallel write) over a period of time. If you continually see DBWR writing out before its 3-second timeout, chances are it is overly active.
Beginning in Oracle8i Database, the default DBWR write batch size is 204 blocks. This is changed from 4096 blocks in prior versions. This means starting in Oracle8i Database, the DBWR write batch size should no longer be a factor that contributes to the write complete waits contention.
====================================================================
Understanding Oracle Free Buffer Wait Events?
The free buffer waits event has three parameters: file#, block#, and set ID. In Oracle Database 10g, this wait event falls under the Configuration wait class. Keep the following key thoughts in mind when dealing with the free buffer waits event.
Before a block is read into the buffer cache, an Oracle process must find and get a free buffer for the block. Sessions wait on the free buffer waits event when they are unable to find a free buffer on the LRU list or when all buffer gets are suspended.
The DBWR process is responsible for making clean buffers on the LRU lists.
Common Causes, Diagnosis, and Actions
A foreground process needing a free buffer scans the LRU list up to a predetermined threshold, usually a percentage of the LRU list. In Oracle9i Database, the threshold is 40 percent. This value is described in the X$KVIT (kernel performance information transitory instance parameters) view as “Max percentage of LRU list foreground can scan for free.” If a free buffer is not found when the threshold is met, the foreground process posts the DBWR process to make available clean buffers. While the DBWR process is at work, the Oracle session waits on the free buffer waits event.
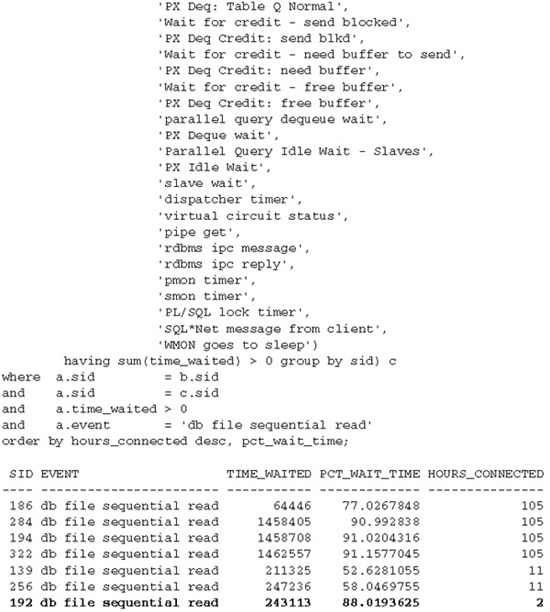
Oracle keeps a count of every free buffer request. The statistic name in the V$SYSSTAT view is free buffer requested. Oracle also keeps a count of every free buffer request that fails. This is given by the TOTAL_WAITS statistic of the free buffer waits event. Free buffer requests are technically buffer gets, if you will, and free buffer requests that fail can be considered as buffer misses. Yet another V$SYSSTAT statistic free buffer inspected tells you how many buffers Oracle processes have to look at to get the requested free buffers. If the free buffer inspected value is significantly higher than the free buffer requested, that means processes are scanning further up the LRU list to get a usable buffer. The following queries list the systemwide free buffer requested, free buffer inspected, and free buffer waits statistics:
If a session spends a lot of time on the free buffer waits event, it is usually due to one or a combination of the following five reasons:
- Inefficient SQL statements
- Not enough DBWR processes
- Slow I/O subsystem
- Delayed block cleanouts
- Small buffer cache
==================================================================
Understanding Oracle Log Buffer Space Wait Events ?
The log buffer space wait event has no wait parameters. In Oracle Database 10g, this wait event falls under the Configuration wait class. Keep the following key thoughts in mind when dealing with the log buffer space wait event.
- Sessions wait on the log buffer space event when they are unable to copy redo entries into the log buffer due to insufficient space.
- The LGWR process is responsible for writing out the redo entries and making room for new ones.
Common Causes, Diagnosis, and Actions
In addition to the log buffer space wait event statistics, Oracle also maintains a session- and system-level redo buffer allocation retries statistic in the V$SESSTAT and V$SYSSTAT view, respectively. The redo buffer allocation retries statistic keeps track of the number of times a process has to wait for space in the log buffer. However, the log buffer space wait event is a better indicator because it contains the TIME_ WAITED statistic.
If a session spends a lot of time on the log buffer space wait event, it is normally due to one or both of the following reasons:
- The log buffer in the SGA is too small.
- The LGWR process is too slow.
Undersized Log Buffer
A small log buffer (less than 512K) in a busy batch processing database is bound to cause sessions to contend for space in the log buffer. As mentioned in the preceding section, you can operate a database with a large log buffer if you set the _LOG_IO_ SIZE accordingly. Therefore, check the current LOG_BUFFER setting and make the proper adjustment if necessary. The log buffer is not a dynamic component in the SGA, so you must bounce the instance before the new value is effective.
Slow I/O Subsystem
A slow I/O subsystem can cause the LGWR process to be unable to cope with the rate of redo generation, and this in turn causes processes to wait on the log buffer space event. New redo entries cannot override entries that have not been written to disks. Make sure the average wait time of the log file parallel write wait event is acceptable. Otherwise, you can improve the I/O throughput using the method discussed in the log file sync section.
So far we have focused on the database. You should also take a look at the application to see if it can be changed to reduce the logging activity. If the log buffer is the place of contention, then perhaps the best thing to do is not to go there, or go there less frequently. Where appropriate, use NOLOGGING operations, bearing in mind that objects created with NOLOGGING are unrecoverable unless a backup is immediately taken. If you intend to use NOLOGGING operations, check to see if the FORCE LOGGING option is turned on as it overrides the NOLOGGING specification. The FORCE LOGGING option can be enabled at object, tablespace, and database levels. Also, look out for bad application behavior that fetches and updates the entire row when only a few columns are actually changed. This can be hard to catch. You may discover this behavior by mining the DMLs from the V$SQL view or redo log files using Oracle Log Miner.
======================================================================
About Oracle RAC Global Cache CR Request Wait Event?
When a process requires one or more blocks, Oracle first checks whether it has those (blocks) in its local cache. The simple hashing algorithm based on the DBA (Data Block Address) is used to traverse the cache buffers chains, and a suitable lock is found if it is in the hash bucket. When a session requests a block(s) that was not found in its local cache, it will request that the resource master grant shared access to those blocks. If the blocks are in the remote cache, then the blocks are transferred using the interconnect to the local cache. The time waited to get the blocks from the remote cache is accounted in the global cache cr request wait event.
NOTE
This event is known as gc cr request in Oracle Database 10g. The ‘global cache’ is changed to just ‘gc’.
The time it takes to get the buffer from remote instance to local instance depends on whether the buffer is in shared or exclusive mode. If the buffer is in shared mode, the remote instance will clone buffer in its buffer cache and ship it to the local cache. Based on the fairness value on that buffer, the lock downgrade may also happen if the number of CR blocks exceeds the _FAIRNESS_THRESHOLD counter value. If the buffer is in exclusive mode (XCUR), the PI has to be built and shipped across the buffer cache. The statistics are incremented according to whether the CUR block or the CR block is shipped.
Typically, global cache cr request waits are followed by the db file sequential/scattered read waits. During the sequential scan a few blocks may be in the remote buffer cache and the rest of the blocks may be on the disks.
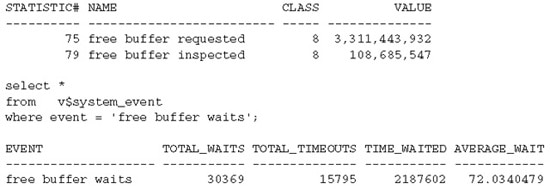
Normally, the requesting process will wait up to 100cs and then retry reading the same block either from the disk, or it will wait for the buffer from the remote cache, depending on the status of the lock. Excessive waits for global cache cr request may be an indication of a slow interconnect. The private interconnect (the high speed interconnect) should be used for cache transfer between instances, and the public networks should be used for client server traffic. In some cases, the RAC may not pick the interconnect, and the Cache Fusion traffic may be routed through the public network. In this case you will see a huge number of waits for global cache cr request. You can use the oradebug ipc command to verify if the private network is used for cache transfer between instances.
Finding the Interconnect Used for Cache Transfer
The following procedure can be used to find the interconnect used for Cache Fusion:
The trace file will contain the details of the IPC information along with the interconnect details:
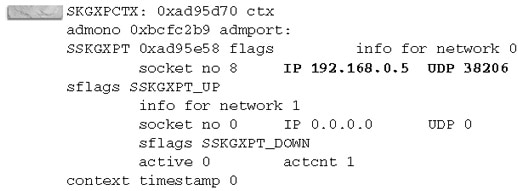
From the preceding trace file, you know the private network 192.168.0.5 is used for the Cache Fusion traffic and that the protocol used is UDP.
NOTE
For some reason, if the right interconnect is not used by the Oracle kernel, the CLUSTER_INTERCONNECTS parameter can be used to specify the interconnect for cache fusion. However, this limits the failover capability during interconnect failures.
Most of the hardware/OS vendors use proprietary high-speed protocols for the private network. The following table gives the short description of the network protocols used in different hardware/OS platforms. Other than the listed cluster servers, Veritas Cluster uses its own protocol (Low Latency Protocol) for the Cache Fusion traffic and cluster-wide traffic.
====================================================================
Oracle Read By Other Session Wait Event?
When a session waits on the “read by other session” event, it indicates a wait for another session to read the data from disk into the Oracle buffer cache. If this happens too often the performance of the query or the entire database can suffer. Typically this is caused by contention for “hot” blocks or objects so it is imperative to find out which data is being contended for. Once that is known, there are several alternative methods for solving the issue.
When information is requested from the database, Oracle will first read the data from disk into the database buffer cache. If two or more sessions request the same information, the first session will read the data into the buffer cache while other sessions wait. In previous versions this wait was classified under the “buffer busy waits” event. However, in Oracle 10.1 and higher this wait time is now broken out into the “read by other session” wait event. Excessive waits for this event are typically due to several processes repeatedly reading the same blocks, e.g. many sessions scanning the same index or performing full table scans on the same table. Tuning this issue is a matter of finding and eliminating this contention.
Finding the contentions
When a session is waiting on the “read by other session” event, an entry will be seen in the v$session_wait system view, which will give more information on the blocks being waited for:
SELECT p1 "file#", p2 "block#", p3 "class#"

 FROM v$session_wait

 WHERE event = 'read by other session';
If information collected from the above query repeatedly shows that the same block (or range of blocks) is experiencing waits, this indicates a “hot” block or object. The following query will give the name and type of the object:
SELECT relative_fno, owner, segment_name, segment_type

 FROM dba_extents

 WHERE file_id = &file

 AND &block BETWEEN block_id AND block_id + blocks - 1;
Eliminating contentions
Depending on the Oracle database environment and specific performance situation the following variety of methods can be used to eliminate contention:
Tune inefficient queries – This is one of those events you need to “catch in the act” through the v$session_wait view as prescribed above. Then, since this is a disk operating system issue, take the associated system process identifier (c.spid) and see what information you can obtain from the operating system.
Redistribute data from the hot blocks – Deleting and reinserting the hot rows will often move them to a new data block. This will help decrease contention for the hot block and increase performance. More information about the data residing within the hot blocks can be retrieved with queries similar to the following:
SELECT data_object_id FROM dba_objects WHERE owner='&owner' AND object_name='&object'; SELECT dbms_rowid.rowid_create(1,, , ,0) start_rowid FROM dual; --rowid for the first row in the block SELECT dbms_rowid.rowid_create(1, , , ,500) end_rowid FROM dual; --rowid for the 500th row in the block SELECT FROM . WHERE rowid BETWEEN AND
Adjust PCTFREE and PCTUSED – Adjusting the PCTFREE value downward for an object will reduce the number of rows physically stored in a block. Adjusting the PCTUSED value for an object keeps that object from getting prematurely put back on the freelist.
Depending on the type of contention, adjusting these values could help distribute data among more blocks and reduce the hot block problem. Be careful to optimize these parameters so blocks do move in and out of the freelist too frequently.
Reduce the Block Size – This is very similar to adjusting the PCTFREE and PCTUSED parameters in that the goal is to reduce the amount of data stored within one block. In Oracle 9i and higher this can be achieved by storing the hot object in a tablespace with a smaller block size. In databases prior to Oracle 9i the entire database must be rebuilt with a smaller block size.
Optimize indexes – A low cardinality index has a relatively small number of unique values, e.g. a column containing state data with only 50 values. Similar to inefficient queries, the use of a low cardinality index could cause excessive number of blocks to be read into the buffer cache and cause premature aging out of “good” blocks.
=======================================================================
Comments
Post a Comment
Oracle DBA Information